
DIY-Garden Network: Report of the second half of 2025 (part 1)
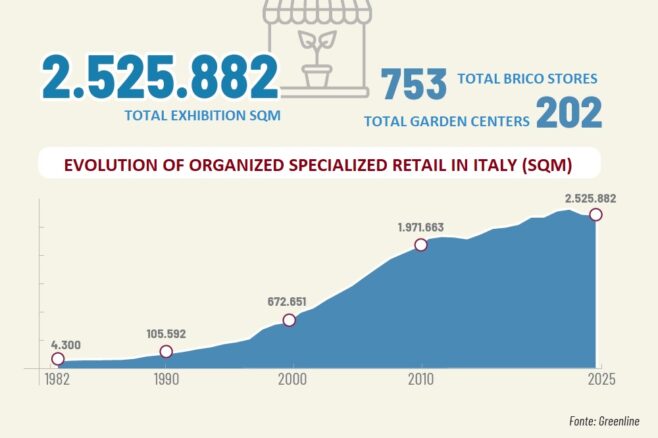
Presented hereafter is the initial installment of the Italian DIY-garden monitoring regarding the second half of 2025. Distributive groups in organized trade specializing in DIY-garden have seen a reduction in the number of stores: 955 compared to 978 at the end of 2024. Exhibition spaces have also decreased by 1.06%. All the latest figures and statistics for the DIY-garden large-scale retail sector, updated to the end of 2025.
In 2025, the network of organized retail stores specializing in DIY and gardening saw a decrease in the number of outlets. This phenomenon must be interpreted in light of the structural trends of the Italian economy, inflation, the contraction of consumption, and the declining purchasing power of households—as well as shifts in consumer behavior and competition within the retail sector.
In 2025, the consumption dynamics of Italian households confirmed a weak and selective demand, with significant implications for non-food retail sectors, such as DIY and gardening.
According to Istat (The Italian National Institute of Statistics) data, retail consumption in 2025 (January–November period) showed zero growth in value for non-food products and a -0.6% decline in volume. Within this, large-scale non-food retail recorded a +0.8% increase, while small shops saw a decrease of -0.9%.
This dichotomy between value and volume is significant and bears witness to the general rise in prices: products cost more on average and, while turnover remains flat, the number of units sold and the average basket value are declining.
Real per capita household spending in Italy remains under pressure due to inflation and prolonged economic uncertainty, both of which contribute to the erosion of real purchasing power. While inflation has not reached the ‘explosive’ levels seen in the 2021/2022 period, it has continued to slowly eat away at the spending capacity of Italian families year after year. With the rising prices of food, energy, and services, consumers have found themselves paying more to buy less. This dynamic tends to penalize sectors such as DIY and gardening, where purchases can be postponed during uncertain times and where a significant portion of demand depends on consumer confidence in their own spending power.
The consumer confidence index recorded by Istat also shows an overall weak and volatile trend in 2025, influenced by economic uncertainties. At the beginning of the year, in January 2025, the consumer confidence index was relatively high at 98.2 points; by November, it dropped to 95.0 points due to a widespread economic downturn and a pessimistic outlook toward the future. Households’ insecurity regarding their future economic situation is inevitably reflected in a tendency to reduce or postpone non-essential purchases—a category that includes the majority of products sold by DIY stores and garden centers.
According to Confesercenti (one of Italy’s leading business associations), the contraction in consumption has hit small-scale retailers more significantly than large-scale retail trade. Neighborhood shops saw a decline in sales volumes, while discount stores and large grocery chains managed to retain customers through aggressive pricing policies. Unsurprisingly, Istat reports growth in e-commerce (+2.9% in the Jan–Nov 2025 period), to which we can add the success of retailers characterized by very low prices: such as the Chinese platforms Temu, Shein, and AliExpress, or the American Wish in e-commerce, as well as the Dutch chain Action, the Danish Normal, and discount stores in ‘physical retail’.
The consequence is that a portion of household demand is shifting toward more efficient or digital distribution channels, where prices are often more competitive or the perceived value is higher. In recent years, e-commerce has continued to gain market share, particularly for non-food consumer products: consumers, especially among younger demographics, are increasingly tending to purchase tools, materials, and home solutions online, attracted by competitive pricing and fast delivery. This ‘digital competition’ does not only siphon traffic away from ‘physical stores,’ but also demands investments in omnichannel strategies and digital services that not all DIY centers can sustain with equal effectiveness. Consequently, the sustainability of ‘traditional’ retail outlets that fail to compete on price, assortment, or purchasing convenience is becoming increasingly compromised.
The rise of what is known as “commercial desertification” is no coincidence, and it has been particularly felt in recent years across inland areas and small municipalities. This phenomenon is often linked to demographic shifts, rising management costs, and the difficulty of maintaining profits with limited foot traffic.
Even when inflation is moderate, the operating costs of a retail outlet (commercial rents, wages, energy, logistics, etc.) remain high compared to previous decades. The inability to pass these increases on to retail prices compounds these difficulties, pushing many chains and independent operators to close underperforming stores and consolidate their “stronger” locations. DIY stores and garden centers are frequently located in peripheral or suburban areas and face growing competitive challenges if they fail to attract an adequate volume of customers.
All of these factors inevitably influenced the development of specialized store networks linked to organized trade formats in 2025, such as large-scale specialized retailers, cooperatives, and buying groups.
THE RETAIL NETWORK SHRINKS IN 2025
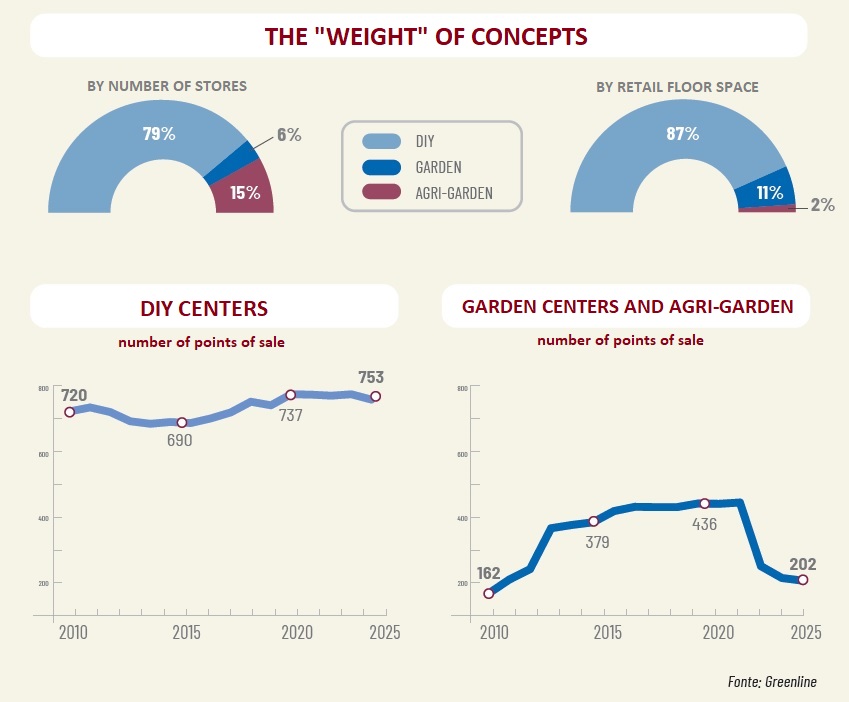
An analysis of the 26 distribution groups specializing in DIY and gardening reveals a 2.35% decrease in the number of points of sale, falling from 978 at the end of 2024 to 955. However, total retail space declined by only 1.06%, moving from 2.552 million square meters in 2024 to the current 2.525 million square meters. This downturn most significantly impacted gardening centers, which dropped from 210 to 202 (a 3.81% decrease), while DIY stores saw a 1.95% reduction, moving from 768 to 753 locations.
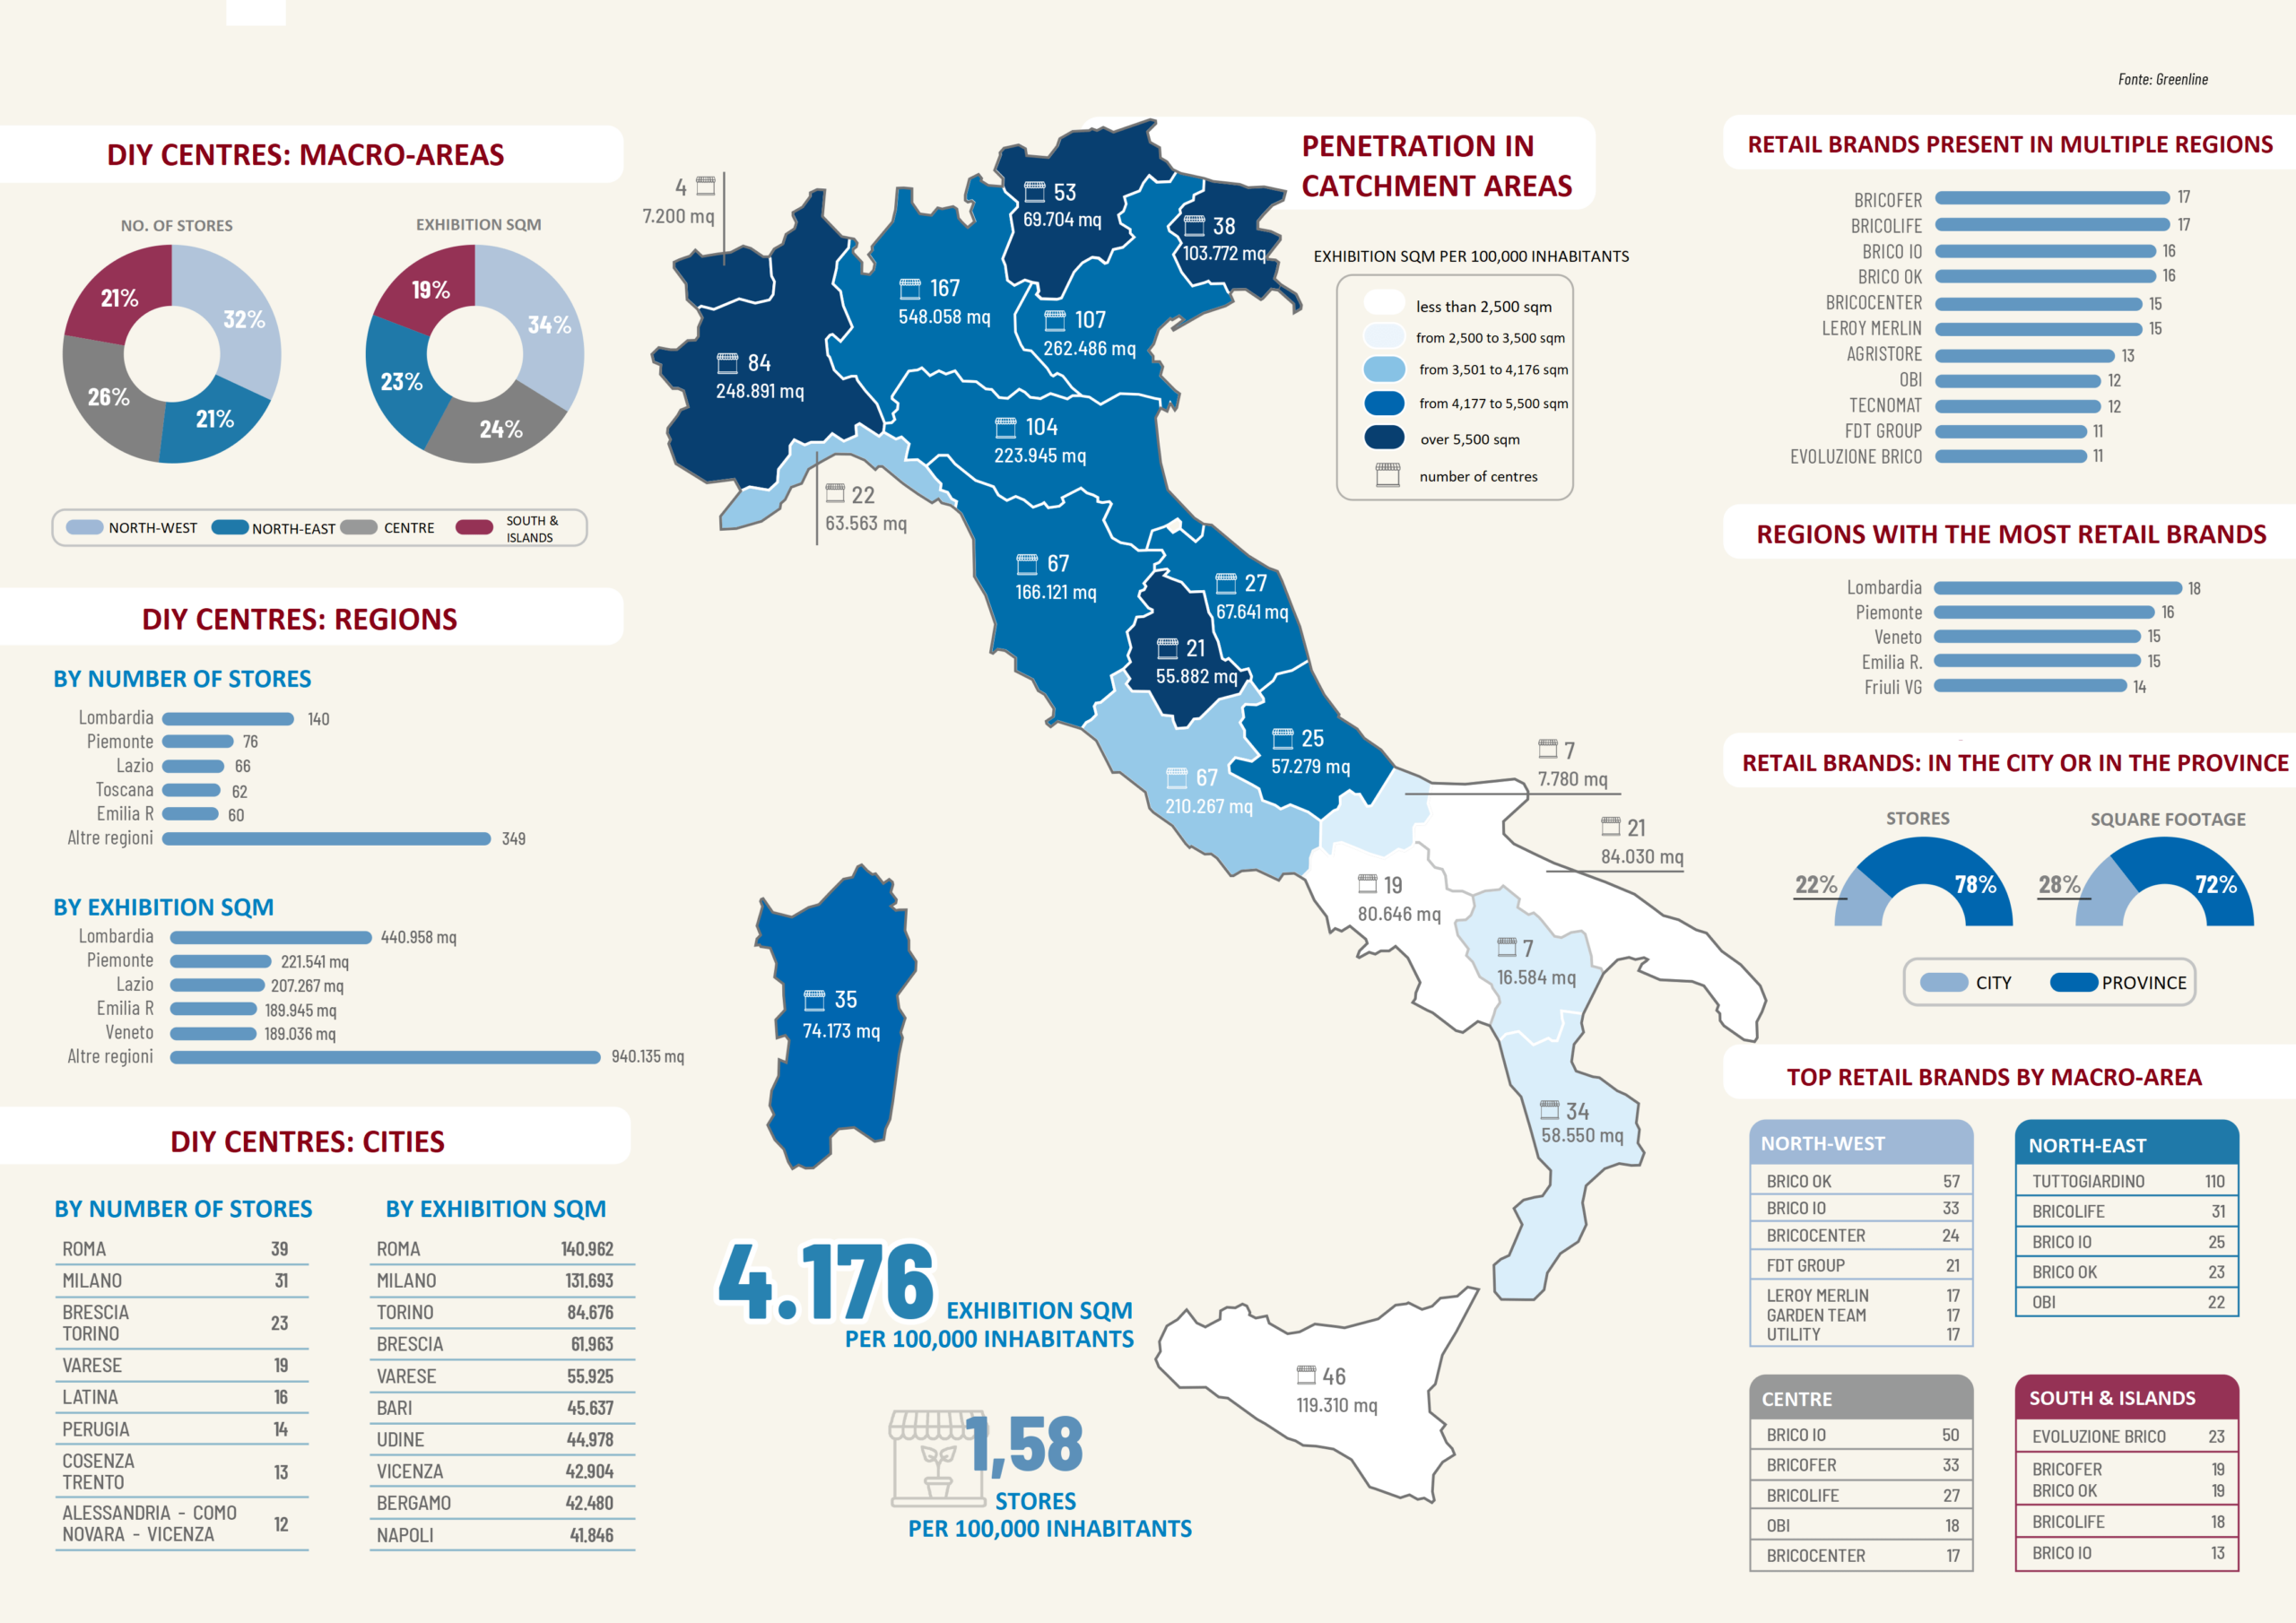
The majority of the 955 total points of sale are located in the North of Italy, which accounts for 60% of both the stores and the total retail space. Central Italy hosts 22% of the outlets, while the South and Islands region represents the remaining 18% of the locations.
Lombardy is the region with the highest concentration of stores, boasting 167 points of sale (down from 168 at the end of 2024), 140 of which are DIY centers (-1). Naturally, it also ranks at the top for exhibition space and hosts the largest number of brands, with 18 in total. However, when analyzing DIY centers specifically, Rome is the city with the highest number of stores: 39 (with 140,962 sqm of retail space) compared to 31 in Milan (with 131,693 sqm).
The ‘commercial desertification’ of city shops has also impacted DIY centers and garden centers: in 2025, only 22% of points of sale were located within cities—totaling 213 stores—compared to 23% (222 stores) at the end of 2024. Retail floor space followed the same downward trend, dropping from 29% in 2024 to 28% in 2025, and decreasing from 736,083 sqm to 718,252 sqm.
PRESENCE ACROSS THE ITALIAN TERRITORY
To compare the various Italian macro-areas and regions, however, it is advisable to use an index weighted by population. It is clear that a larger population and the presence of major metropolises attract more attention, more points of sale, and larger exhibition spaces. By relating the exhibition area to the population, we find that, on average, Italians have 1.58 stores and 4,176 sqm available per 100,000 inhabitants (compared to 4,221 sqm at the end of 2024).
In the Northeast regions, the figure rises to 5,669 sqm per 100,000 inhabitants (down from 5,704 sqm), driven by peaks in Friuli (8,528 sqm) and Trentino (6,529 sqm). The specialized retail group with the highest number of stores in the Northeast is Tuttogiardino, with 110 outlets. It is followed by: Bricolife (31 stores), Brico io (25 stores), Brico Ok (23 stores), Obi (22 stores).
The Northwest regions, with an average of 5,391 sqm (down from 5,571 sqm), are driven by peaks in Piedmont (5,688 sqm) and Lombardy (5,461 sqm). In contrast, Liguria performs slightly below the national average, with 4,082 sqm per 100,000 inhabitants. In the Northwest, the standout players are Brico Ok with 57 stores, Brico io (33 stores), Bricocenter (24 stores), Fdt Group (21 stores), and Leroy Merlin, Garden Team, and Utility with 17 stores each.
Central Italy has an average of 4,169 sqm per 100,000 inhabitants, which is slightly below the national average. Umbria (6,317 sqm), Marche (4,416 sqm), Tuscany (4,445 sqm), and Abruzzo (4,355 sqm) all rank above the national average, while only Lazio falls below it (3,566 sqm). In Central Italy, Brico io is the most prominent chain with 50 stores; it is followed by Bricofer (33 stores), Bricolife (27 stores), Obi (18 stores), and Brico Ok (17 stores).
The South and Islands region halts at 2,276 sqm per 100,000 inhabitants, with only Sardinia recording a result above the national average at 4,500 sqm. In the South and Islands area, the prominent players are Evoluzione Brico (23 stores), Bricofer (19 stores), Brico Ok (19 stores), Bricolife (18 stores), and Brico io (13 stores).
If we shift the focus from the number of stores to the total exhibition surface area, Leroy Merlin ranks at the top in all macro-regions, with the exception of the Northeast, where it is preceded by Obi. Conversely, the most widespread chains across the country are Bricofer and Bricolife, present in 17 Italian regions, followed by Brico io and Brico Ok with 16 regions.
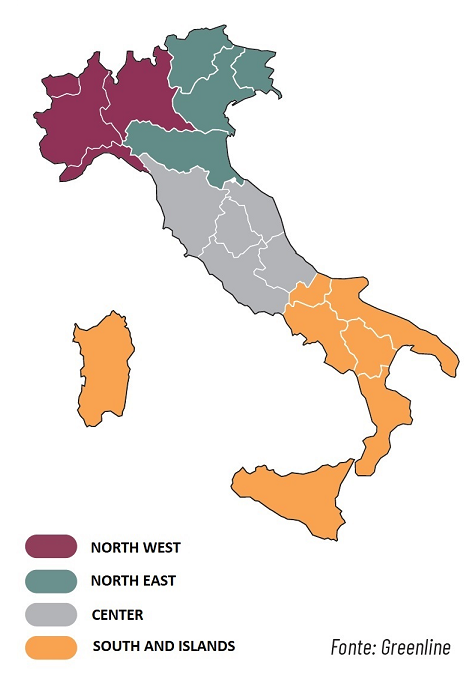
Keep notice. To better understand the text, it is important to keep in mind that Italy is conventionally divided into 4 macro-areas:
- The North West: Aosta Valley, Piedmont, Liguria, Lombardy
- The North East: Trentino-South Tyrol, Veneto, Friuli Venezia Giulia, Emilia-Romagna
- The Center: Tuscany, Umbria, Marche, Abruzzo, Lazio
- The South and Islands: Molise, Campania, Apulia, Basilicata, Calabria, Sicily, Sardinia
DIY CENTERS IN ITALY
If we analyze DIY centers alone, we find that the ‘weight’ of Northern Italian regions is slightly reduced. In fact, the percentage drops to 53% of stores (up from 52% in 2024) and 58% of total retail space (up from 57%). Conversely, in the South + Islands area, we find 21% of stores, a slight decrease compared to 22% at the end of 2024
The figures indicate that stores in the North tend to have larger average dimensions. In contrast, neighborhood stores and mid-sized outlets are concentrated across the rest of the country, reflecting both population distribution and Italy’s unique geographical landscape.
Even within the ‘DIY’ world, Lombardy dominates with 140 centers and over 440,000 sqm of retail space, despite recording a slight decrease compared to the 141 stores and 459,000 sqm at the end of 2024. Following behind are Piedmont, with 76 stores and 221,541 sqm (down from 79 centers and over 232,000 sqm), and Lazio, with 66 stores and 207,267 sqm (formerly 71 units and 216,000 sqm).
As we’ve mentioned, in Lazio, Rome’s performance is particularly notable with 39 stores (down from 41), followed by Milan (31), and both Brescia and Turin with 23 centers each. However, if we analyze the rankings by retail space, the leaders after Rome, Milan, Turin, and Brescia are Varese, Bari, Udine, Vicenza, Bergamo, and Naples.
METHODOLOGY OF THE SURVEY
The ‘Gds Brico-Garden Monitoring’ is a semi-annual survey that the author has conducted continuously since 1988. To analyze the evolution of organized retail formats specializing in DIY and gardening within Italy, we selected Large-Scale Specialized Retail brands and Buying Groups (consortia, voluntary unions, etc.) that meet two primary criteria: a presence of at least three points of sale and a propensity for development—defined as the systematic opening of new stores, whether company-owned (direct) or franchised.
The display areas indicated refer to indoor sales floor space; therefore, parking lots, offices, and warehouses are excluded.
By ‘company-owned stores’, we mean outlets owned directly by the retail group; by ‘franchised stores’ (or ‘affiliates’), we mean outlets owned by private entrepreneurs who participate in organized retail formats (such as franchising) or are affiliated with buying groups and consortia.
All data are provided by the retailers themselves and processed by the author. In the rare instances where estimates are used, they are always specified in the charts.